
The most expensive variable in your organization
is the one you're not measuring.
Skills don't disappear under pressure. They go offline. The senior manager who handled crisis brilliantly in March writes a career-limiting email in November. Same person. Same skills. Different state.
Capacity shows up in individuals. What drains it comes from how the work demand itself is structured. Emergent Skills works at both levels. Skip either and the other fails.
Executive Summary How it works. What it costs. How to start. +
Capacity drops months before your KPIs do.
Capacity is how much of their own skill set your people can actually access right now. It fluctuates daily, in everyone, measurably, and it drops when work demand outruns what they have left to meet it with. The same team executes brilliantly at 10 AM and produces an expensive error by 3:30 PM. The skills did not disappear at lunch. Access to them dropped.
The cost runs roughly $5M annually for a 1,000-employee company, drawn from a peer-reviewed CUNY/Johns Hopkins model. The audit reports a defensible floor plus two additions, never one blended figure. The floor is the operational capacity cost, computed from your own data, and Meeting, Decision Density, and Manager Load are the lenses that drive and explain it. On top of the floor the audit adds the Recovery Debt Tax (attrition, from your turnover data) and reports the Forfeited Upside Tax separately (co-authored from your pipeline, usually the largest).
The engagement is sequenced. Work Demand Diagnostic (half-day) names the dominant pattern and tells you whether a full audit is warranted. Audit (3 to 8 weeks) diagnoses where capacity is dropping and what it is costing. Pilot (12 weeks) redesigns the work demand on one team and produces a case study built from your data. License deploys the system at scale, with quarterly executive reviews tracking your operational capacity cost.
Pricing. Work Demand Diagnostic is $3,500 to $7,500. Audit starts at $15K to $25K for a single team (5 to 15 people), scaling through Department, Function, and Enterprise tiers. Pilots typically scope between $120K and $180K. License tiers start at $480 per employee per year on Foundation (200+ employees, $96K minimum).
Three Design Partner slots for 2026. Senior consultant leads the engagement, with the founder personally involved at the key moments. Anchor case study positioning when the firm scales past the design partner phase. Design Partners receive 15% off the first engagement.
Not wellness. Not therapy. Not engagement. Operating design for the variable that determines what your organization actually produces.
We do not label performance problems as capacity problems unless they pass four tests.
Start With the Work Demand Diagnostic → See what it is costing you →
What This Looks Like Before You Have a Name For It
Most leadership teams have already lived through several of these. Nobody filed them under "capacity." They got filed under whoever was in the room.
Your best manager just made the worst call of the quarter.
The team that crushed Q2 is somehow gridlocked on Q3. Same people. Same skills.
Your highest performer just quit and nobody saw it coming.
A 30-minute meeting just consumed two hours. Nothing got resolved. Everybody's tired.
Three senior people are in conflict and all of them are right about the facts.
You spent $200K on leadership training and nothing changed on the floor.
These look like performance problems, or culture problems, or hiring problems. They almost always get solved as one of those things. The variable underneath them rarely gets measured, which is part of why the same scenes keep playing out.
We do not label performance problems as capacity problems unless they pass four tests.
Start here
The Work Demand Diagnostic is the fastest path to naming which of these patterns is driving cost in your organization. Half-day working session for managers and team leaders. Three hours. $3,500 to $7,500. No pre-work, no follow-on commitment.
Where the cost concentrates
The Five Capacity Taxes
Five shapes the cost takes.
The patterns above produce cost in five organizational shapes. The audit reports a defensible floor plus two additions, never one blended figure. The floor is the operational capacity cost, computed from your own data, and Meeting, Decision Density, and Manager Load are the lenses that drive and explain it. On top of the floor the audit adds Recovery Debt (attrition, from your turnover data) and reports Forfeited Upside separately (co-authored from your pipeline).
Drives the floor
Meeting Tax
Loaded labor cost of meetings that produce no decision or shipped output.
Coordination overhead consuming the hours when capacity is highest. Visible in your existing calendar data. Shows up as the most cognitively demanding work having nowhere to land, and decisions repeatedly getting deferred to the next meeting.
Drives the floor
Decision Density Tax
Cost of reversed decisions, missed forecasts, rework.
The pattern is familiar to any leader who has signed off on a vendor at 5pm Thursday and reversed the call by Monday morning. Decision quality degrades as decisions stack up beyond what current capacity can metabolize. The errors cluster predictably in the back half of the day and the back half of the week.
Audit adds
Recovery Debt Tax
Replacement cost of regretted attrition. 50 to 200 percent of base.
A senior PM who has been quietly running on fumes for two quarters resigns the week after she finally takes a real vacation. The vacation did not cause it. It surfaced what was already there. Recovery debt compounds in private. By the time it is visible to HR it is usually too late to keep the person. The audit adds this to the floor from your own turnover data.
Drives the floor
Manager Load Tax
Forecast-to-actual delivery variance from bottlenecked routing.
A VP cancels her deep work block three weeks in a row because every decision in her org still routes through her calendar. Her team is not underperforming. They are waiting in line. The bottleneck is not a person. It is the routing.
Reported separately
Forfeited Upside Tax
Strategic initiatives that landed in the plan but never shipped.
A Q4 retro where the strategic initiative that defined the year's plan never shipped, and no one can quite name why. Maintenance work shipped. The bet did not. Strategic and creative work needs high-capacity state to be executed well. When that state never gets allocated, the upside does not show up as a loss on any line item. It just does not happen. It is co-authored from your own pipeline and kept separate from the floor, because it rests on your assumptions rather than research. It is usually the largest tax of all. How to stop the loss.
The audit names which taxes are concentrating cost in your organization, prices each one, and ranks them.
Where Capacity Cost Concentrates In Different Industries
Different industries drain capacity in different places. What varies is which tax dominates the picture: which pattern most drives the operational floor, and which of the two additions (Recovery Debt or Forfeited Upside) carries the most weight.
Pharma, Biotech, and Innovation-Dependent Organizations
Dominant tax: Forfeited Upside. The strategic move your team would have seen at Green capacity. The pipeline opportunity that got captured and never developed. The competitor who moved first because your organization was too depleted to connect the dots. For organizations whose competitive advantage runs on pattern recognition and creative output, this is typically the largest single tax.
Financial Services and Investment Firms
Dominant tax: Decision Density. Consequential decisions made in depleted capacity states. The Yellow-zone call that costs real money, the Red-zone trade that should have been a pass, the late-afternoon approval that didn't get the scrutiny it needed. Where stakes are high and density is relentless, decision quality under depletion is the cost center. Private equity is a current priority focus.
Professional Services, Law, and Consulting
Dominant taxes: Meeting and Recovery Debt. Billable hours quantify what unmanaged capacity costs with unusual precision. Every hour spent in a reactive meeting is an hour not billed. Every recovery debt that burns out an associate is training investment written off. The economic model makes the capacity problem unusually visible. And unusually expensive.
Healthcare Systems and Clinical Operations
Dominant tax: Manager Load. Clinical managers carry their own cognitive load plus the absorbed load of their teams. Manager depletion in healthcare correlates directly with clinical error rates, team turnover, and the retention problem driving the staffing crisis. When the managers can't carry it, the system can't function.
Your organization's pattern may cluster differently. The Capacity Audit identifies which taxes are concentrating your cost and in what proportion.
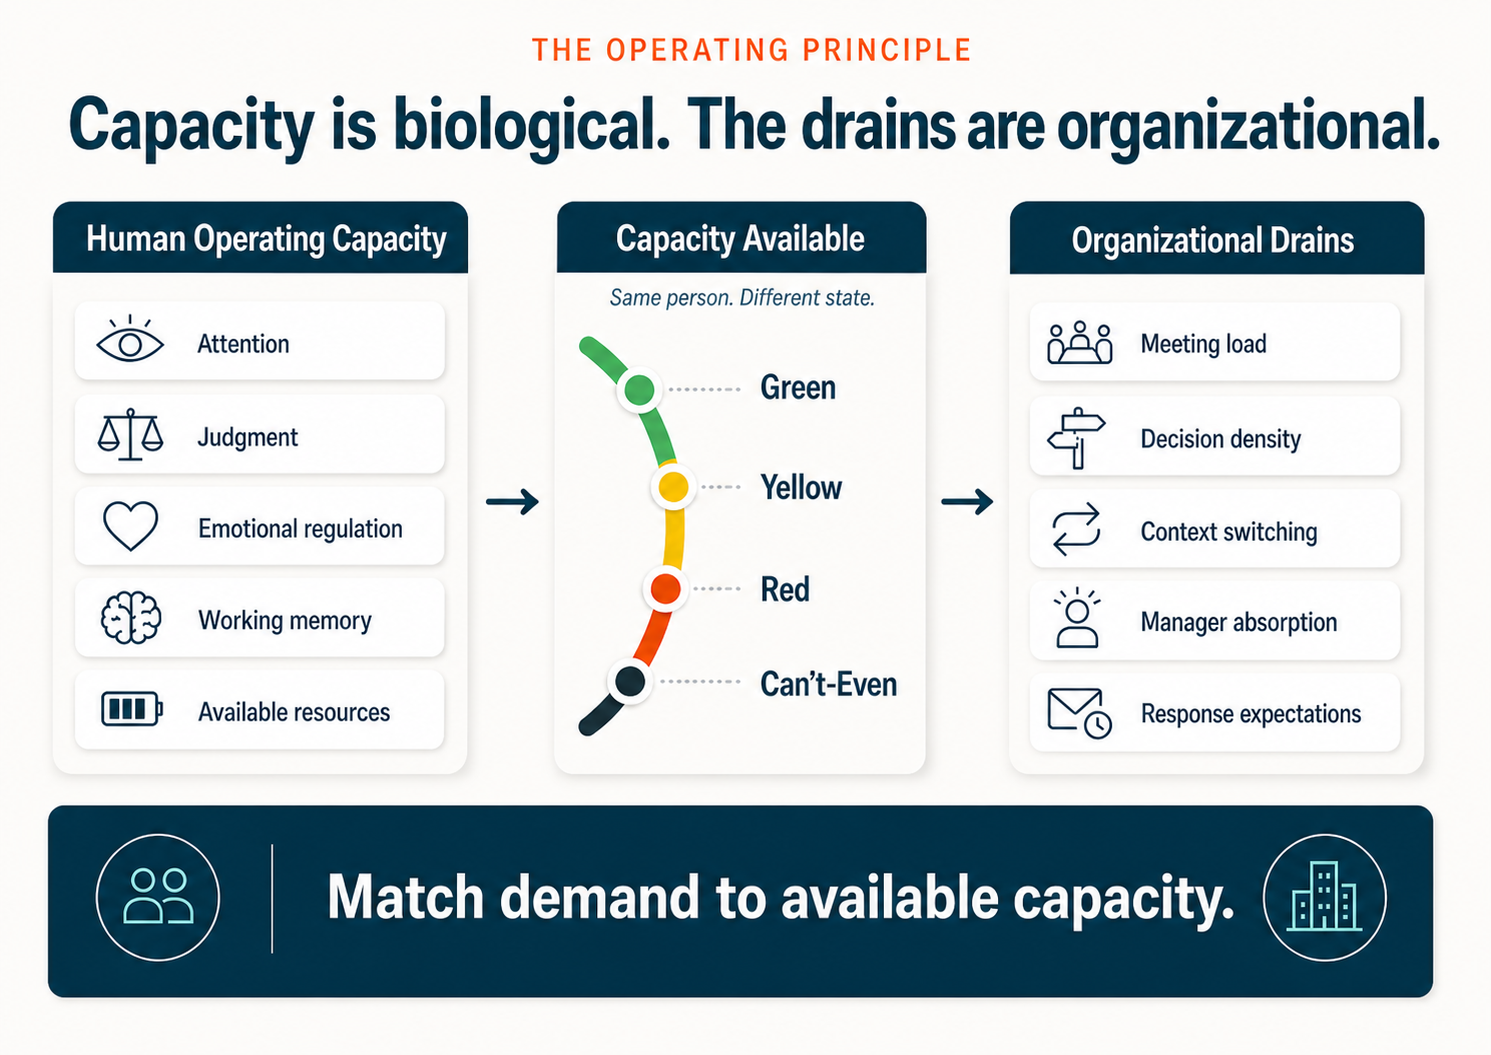
The operating principle
Capacity is biological.
The drains are organizational.
Capacity is how much of their own skill set your people can access at any given moment. It moves hour to hour. The work demand draining it (meeting load, context switching, decision density, the way work flows through your organization) is not a natural law. Somebody designed it. Which means it can be redesigned.
Research context: A 2026 study in Science Advances found that daily capacity fluctuations cost the equivalent of 30 to 40 minutes of productive work per day, and that grit and conscientiousness do not protect against the drops. A CUNY/Johns Hopkins computational model estimates that unmanaged capacity costs a 1,000-employee company roughly $5 million per year.

Built by a Systems Thinker
Jim Wilde, founder of Emergent Skills. Decades of enterprise systems work, including nine years as a consultant and lead developer on the public-facing digital application for the Metropolitan Transportation Authority. The mta.info platform millions of people depend on every day.
Capacity Intelligence is documented in full in his book CAPACITY: The Variable No One Measures. Standard engagements are led by senior delivery consultants. The founder owns the methodology, judgment calls on edge cases, and is closer to the work for Design Partner engagements at the key moments.
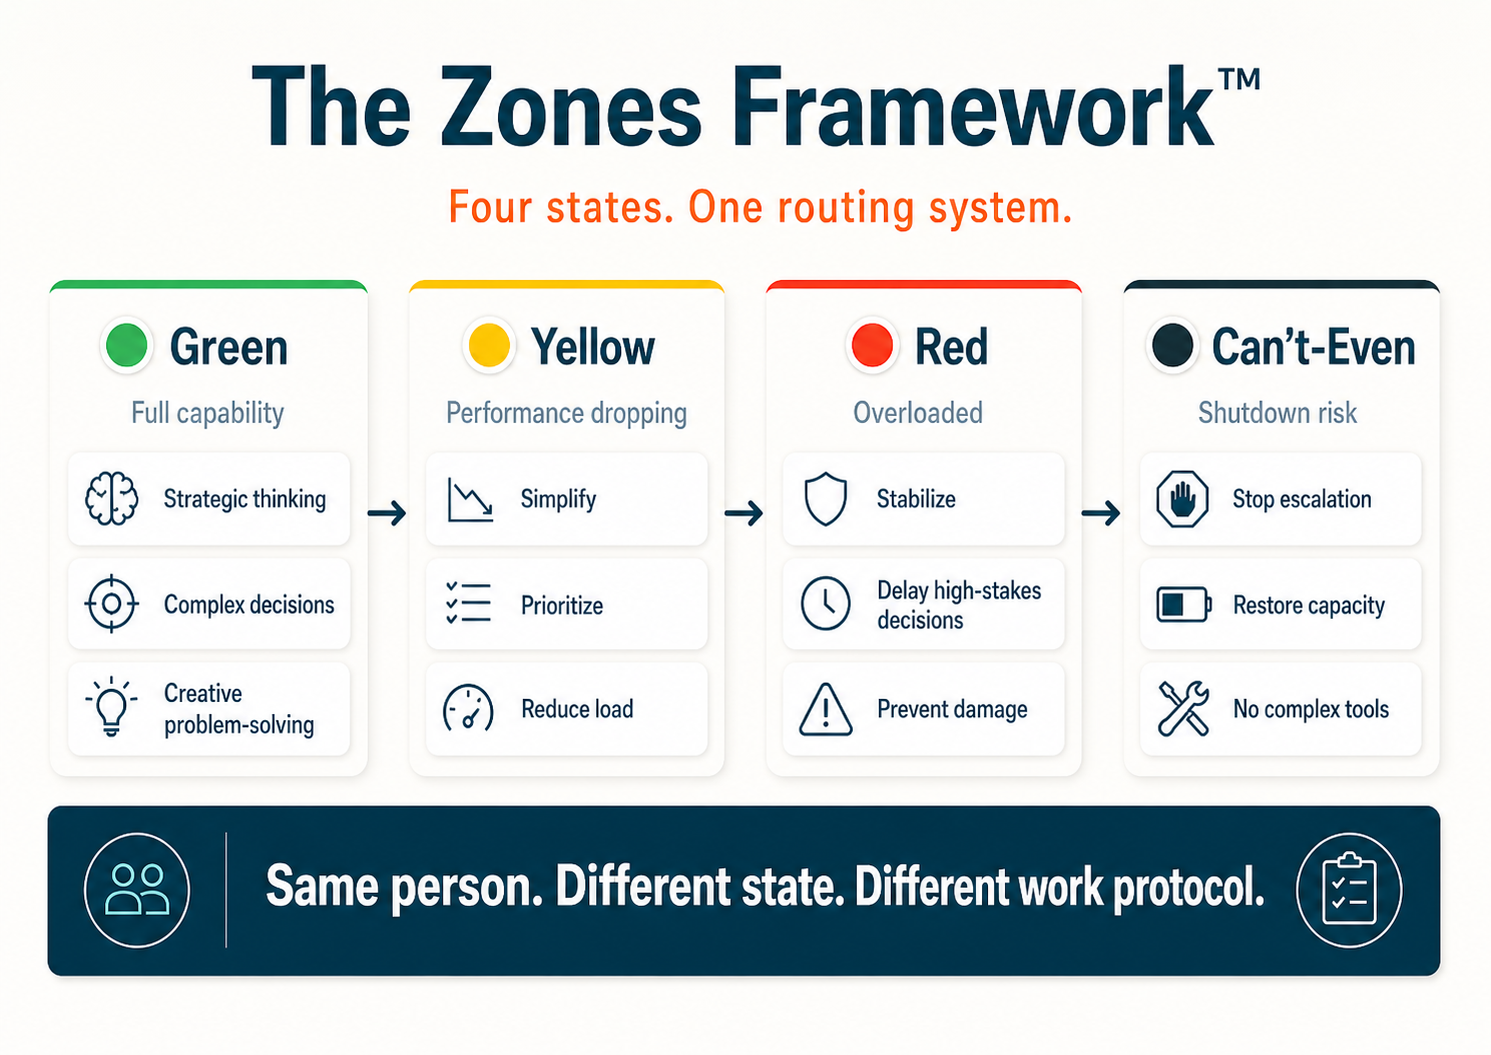
The Zones Framework™
Four states. One routing system.
The Zones aren't a personality model. They're how you route work to the state that can execute it.
How it operates
The Zones Framework runs as a daily operational tool through the Capacity Zones platform. Already deployed with individual professionals and available to enterprise teams as part of the License tier. The framework isn't theoretical. It's running.
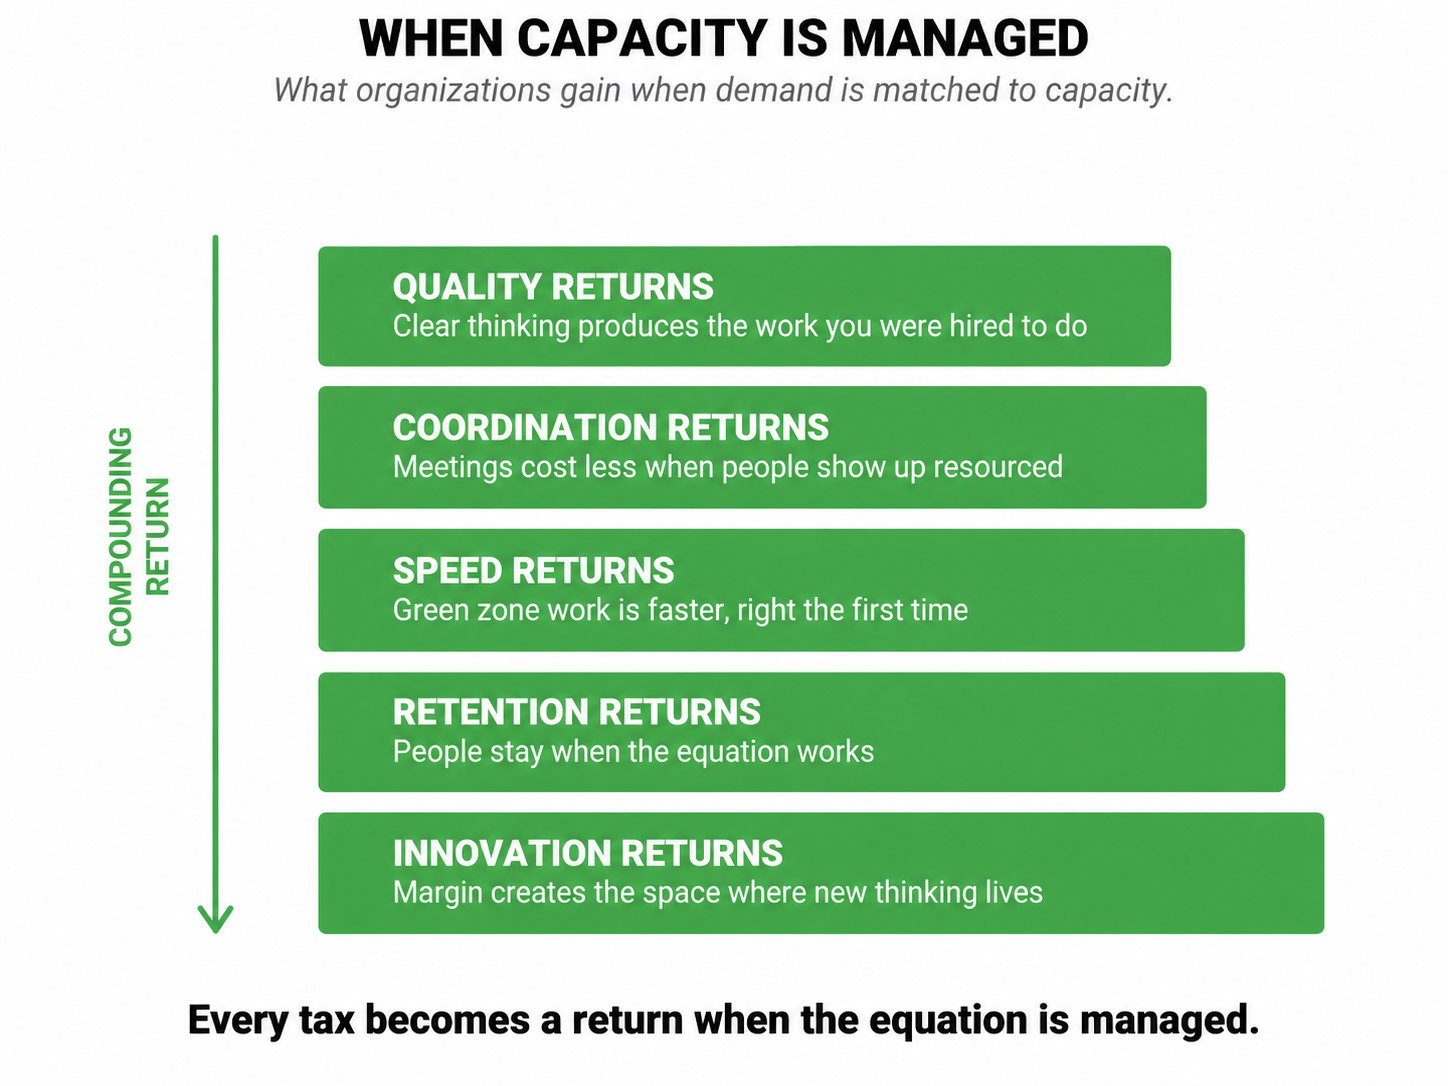
What Changes When Capacity Is Managed
The 3:30 PM Decision Stops Happening
When your people can read their own state before a high-stakes moment, the expensive late-afternoon call stops getting made. The judgment was always there. They couldn't reach it at 3:30. Now they can.
Reactive Communication Drops
The emails that torch relationships, the meetings that escalate instead of resolve, the feedback that lands wrong. These aren't character flaws. They're capacity signals. Your managers learn to see them and intervene before the damage lands.
The Drift Becomes Visible
Right now, you see the resignation letter. You see the blown deadline. You see the conflict. With capacity as a managed variable, you see the trajectory weeks before the event. That's the difference between firefighting and infrastructure.
Training Actually Lands
Most L&D fails because the people in the room don't have the capacity to absorb what's being taught. The content might be excellent. Doesn't matter. They can't reach it. Deploy training when capacity is there to receive it, and your development budget stops vanishing into people who couldn't use it.
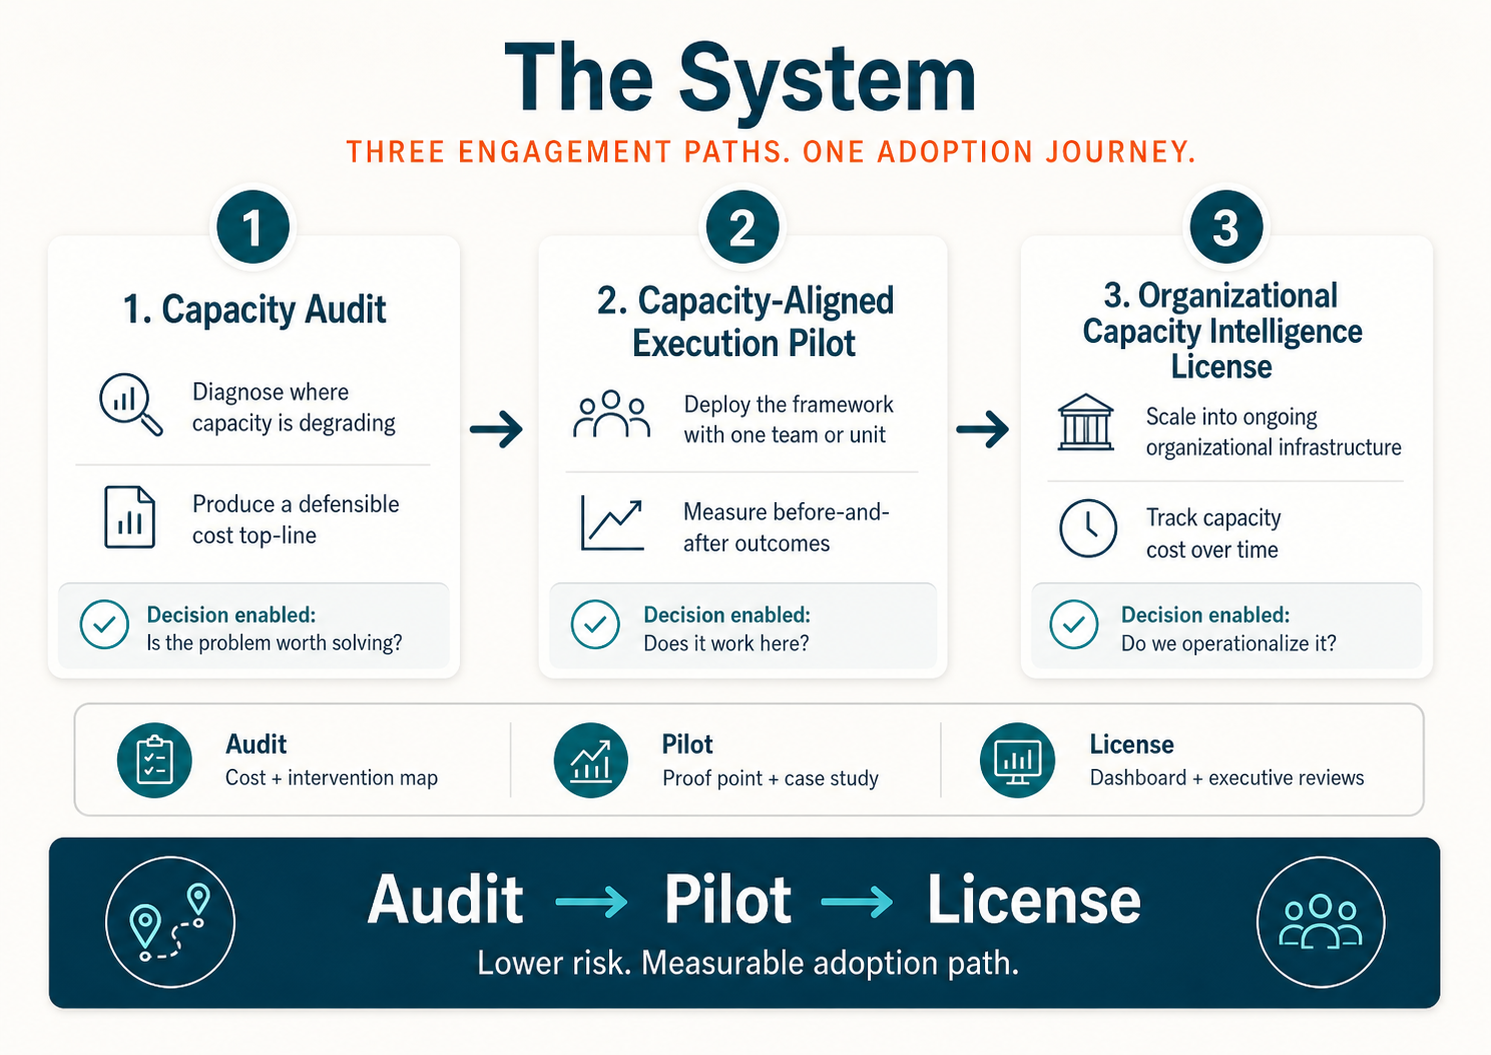
Four engagement paths, sequenced because evidence from one makes the next land. The diagnostic comes first. The audit follows when the diagnostic says it is warranted. The pilot comes next. The license is for organizations that decide capacity is infrastructure, not a project.
Work Demand Diagnostic
A half-day working session for managers and team leaders. Three hours. We map the patterns the room names to the five capacity taxes, run the cost calculator live against your own numbers, and leave you with a one-page summary and a directional cost floor. Tells you whether a full audit is warranted and where it should point first. $3,500 to $7,500. No pre-work, no follow-on commitment.
Capacity Audit
A structured assessment of where capacity is degrading across your organization and what it's costing. The floor is the operational capacity cost, computed from your own data, with Meeting, Decision Density, and Manager Load as the lenses that explain it. On top of the floor the audit adds Recovery Debt and reports Forfeited Upside separately. You get a report your CFO can read, and a ranked list of interventions.
Capacity-Aligned Execution Pilot
A 12-week engagement with one team or business unit. The full framework deployed, the work demand redesigned, before-and-after measurement, and a case study your organization owns. The Manager Execution Capacity Cohort runs concurrently on the pilot manager. Every scaled rollout needs a proof point. The pilot produces yours.
Organizational Capacity Intelligence License
An annual license that deploys the full system as ongoing organizational infrastructure: the Zones Framework as shared language, Manager Capacity Certification in annual cohorts, an organizational capacity dashboard, and quarterly executive reviews against the operational capacity cost. The license is what this looks like when an organization decides it isn't a project to finish.
For your budget conversation
Work Demand Diagnostic is $3,500 to $7,500. Audit engagements scale by tier: $15K to $25K for a single team (5 to 15 people), $35K to $55K for a department (15 to 75), $65K to $95K for a function (75 to 300), with custom pricing for enterprise-wide engagements. Pilots typically scope between $120K and $180K. License pricing is annual and tiered by knowledge-worker headcount, starting at $480 per employee per year.
Every engagement is benchmarked against the operational capacity cost the audit produces, so the spend has a number sitting next to it before it gets approved. Full pricing →
2026 Design Partner Cohort · Three Slots
Early adopters shape the category.
Three Design Partner slots are available in 2026. Senior consultant leads the engagement, with the founder personally involved at the key moments. Anchor case study positioning when the firm scales past the design partner phase. Design Partners receive 15% off the first engagement. For organizations whose leadership is comfortable being early adopters of a new category.
Apply for a Design Partner Slot →
Applications close when the three slots are filled.
Questions
Not every performance problem is a capacity problem. If a person underperforms while rested, unloaded, clear on expectations, and not under threat, the cause is not capacity. It is skill, effort, role fit, or training, and it should be managed as such. Capacity Intelligence does not erase accountability. It sharpens it by forcing the first diagnostic question: does this person lack the capability, or did they have it and fail to reach it under the conditions of the moment? The audit is built to tell those two apart, so you stop spending training budget on a capacity problem and stop excusing a performance problem as capacity.
It makes them work. Most training is delivered without regard to whether participants have the capacity to absorb it. The Zones Framework gives your L&D team a capacity layer. Deploy training when people can use it, and stop wasting budget delivering it when they can't.
A 12-week engagement with one team or business unit. Weeks 1-2 establish the baseline. Weeks 3-10 redesign the work demand across the intervention dimensions. Weeks 11-12 measure outcomes and produce the case study. You walk away with the dataset and the findings on your own people, whichever way they land, including the parts that don't flatter the intervention.
Start with the Capacity Cost Calculator, which models the operational cost of unmanaged capacity using your own numbers. A Capacity Audit refines that into a defensible operational capacity cost floor built from your labor data, then adds Recovery Debt from your turnover data and reports Forfeited Upside separately. A Pilot measures the delta before and after 12 weeks of structured intervention. A License tracks the delta at the organizational level through quarterly reviews. The math is concrete at every level.
No. Individual usage is completely private. No employer visibility, no manager dashboards showing who used what. The organization gets aggregate capacity data and outcomes. Employees get a private tool they'll actually use because they trust it. That trust is the product.
Your strategy is only as executable as your workforce's capacity to execute it.
Skills, judgment, communication. None of it shows up reliably without capacity behind it. Emergent Skills makes that variable visible and operational. Both at the individual level and at the work demand draining it.