
Your work system is already collecting these taxes.
The audit shows which ones to fix first.
Meeting Tax. Decision Density Tax. Recovery Debt Tax. Manager Load Tax. Forfeited Upside Tax. They show up as slow decisions, overloaded managers, rework, regretted attrition, and strategic work that never ships.
Capacity is the access your people have to their own skill set on any given day. It fluctuates. The audit puts a number on what your organization is losing when that access drops. You get a findings report built for an operations review: the cost tied to specific patterns your teams are operating under, and an intervention plan ranked by estimated top-line reduction per dollar invested.
This is not a new initiative. It is a way to see the cost your organization is already paying off the books.
Executive Summary A number. The patterns producing it. The priority list. +
The audit puts a defensible dollar figure on unmanaged cognitive capacity inside your organization. The cost tied to specific patterns your teams are operating under. Interventions ranked by estimated top-line reduction per dollar invested.
What gets measured: the Five Capacity Taxes.
- Meeting Tax
- Decision Density Tax
- Recovery Debt Tax
- Manager Load Tax
- Forfeited Upside Tax
Each tax measured against your data. Two of them, Recovery Debt and Forfeited Upside, anchor the top-line capacity cost. The other three are diagnostic lenses that show which patterns concentrate the cost and which interventions map to it. A business case, not a diagnosis.
Why now: the 2024 to 2026 AI deployment wave did not create a sixth tax. It made the existing five run hotter. Validation load, workslop, cognitive debt, and sycophancy amplify the patterns that were already there. And the load does not land evenly. It concentrates on your most capable people. The senior IC who quietly carries three teams. The director everyone routes escalations through. When the capability penalty lands hard enough, you do not lose a headcount. You lose the load-bearing wall.
What you receive: a one-page COO Brief, a 30 to 45 page findings report, a 15 to 20 slide executive presentation, a data appendix, and a prioritized opportunity map.
How it runs: three parallel streams. Capacity State Survey, calendar pattern analysis, and structured manager interviews. Total employee time required: under 20 minutes per participant. Total leadership time: roughly 6 hours across the engagement.
Pricing starts at $15K to $25K for a single team (5 to 15 people) and scales through Department, Function, and Enterprise tiers. Most first engagements scope to a Team or Department.
Three Design Partner slots for 2026. Senior consultant leads the engagement, with the founder personally involved on methodology, findings review, and the executive readout. Anchor case study positioning when the firm scales past the design partner phase. Design Partners receive 15% off the first engagement.
Not an engagement survey. Not an EAP utilization report. A defensible dollar figure tied to operating patterns, with the changes ranked.
Your organization already pays for unmanaged capacity. The audit gives you a number.
A 2025 CUNY/Johns Hopkins model puts the loss at roughly $5 million per year for a 1,000-employee company. Industry estimates from McKinsey and Gallup land in the trillions globally. Pick whichever number you find credible. The audit produces a figure specific to your organization, with the patterns driving it named, and surfaces the cost no industry model captures: the opportunities your teams are missing in real time because the hidden work has eaten the room they needed to see them.
What the Audit Surfaces
Capacity drops when the operating environment spends cognitive, emotional, and physical resources faster than the people in it can restore them. Not because people are weak. Not because of bad attitudes or poor time management. The system gets overloaded in specific, measurable ways.
The audit looks at four clusters of overload. Some are familiar. Some are not.
People start the day already in deficit. Poor sleep is the cleanest capacity killer. Unresolved conflict that the brain rehearsed at 3am sits in working memory all day. The person walks in looking available, but part of their system is already occupied.
Cognitive load runs hot during the work itself. Decision density, where seven small inbox decisions before 9am each burn prefrontal resource. Meetings that consume attention, social processing, working memory, and context-switching recovery. Interruptions that look harmless but deposit someone else's problem into your working memory and leave residue that follows you into the next task.
Affective load runs underneath the work. Threat and ambiguity from reorg rumors, status anxiety, unclear feedback. Shame after a low-capacity mistake that turns into background self-monitoring. The nervous system reads threat and the prefrontal cortex loses priority. People become more reactive, more binary, less creative. None of it appears in any work tracking system.
The organization itself produces structural patterns that compound the rest. Demand clusters at end of quarter, launch week, reorgs, annual planning, performance reviews, client escalations. Recovery margin disappears, so each cycle starts lower than the last. And the capability penalty concentrates the load on the most capable people because they are the ones who can be trusted with hard work.
Most companies manage tasks, time, headcount, and output. They do not manage the demand load those things create. That is where the business case lives. Not wellness. Not therapy. Operating design.
We name the patterns running in your organization and put a cost on each. We call them the Five Capacity Taxes.
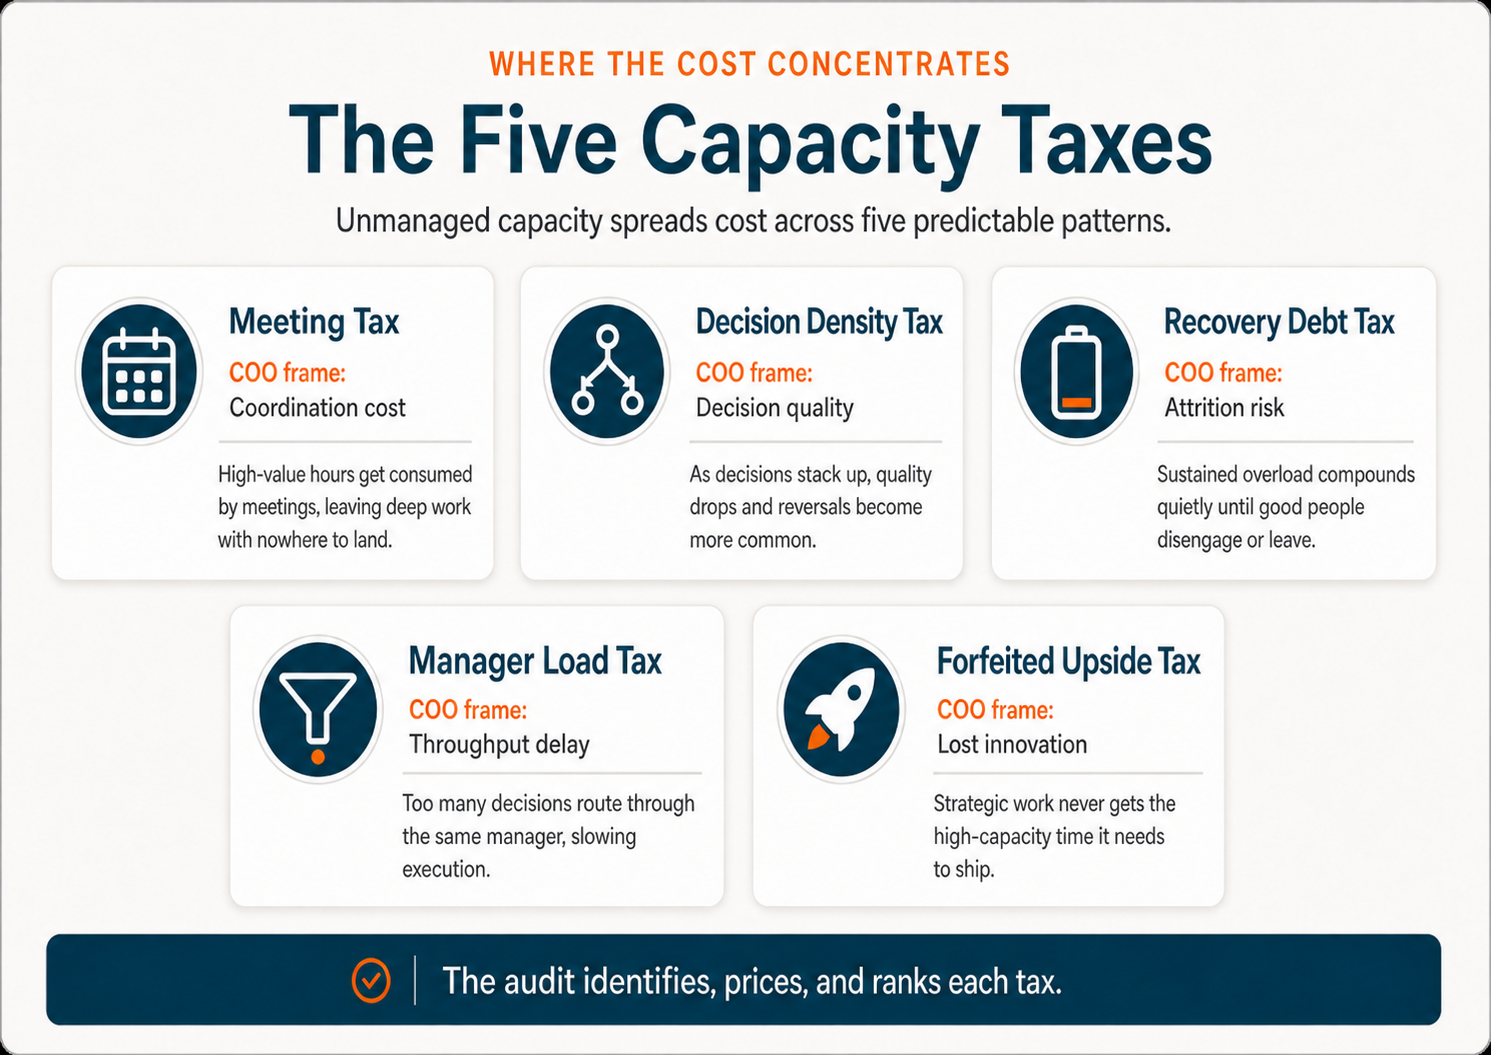
They are not five categories I sat down and brainstormed. They are the five places I kept watching capacity disappear, across years of working with individuals and small teams. Each tax has an AI angle to it that the audit measures alongside the underlying tax.
The Meeting Tax (coordination cost)
The percentage of your workforce's productive hours eaten by low-value meetings, context switches, and coordination overhead. In many knowledge-work organizations, this can consume a large share of productive time once meetings, follow-up, and context switching are counted.
The AI dimension here has a name. Stanford and BetterUp call it workslop: AI-generated content that masquerades as good work and lands in someone else's inbox for them to clean up. 40% of desk workers report receiving it in the last month, at an average of nearly two hours spent per instance. BetterUp and Stanford put the cost at $186 per affected employee per month, which works out to over $9 million a year in lost productivity for a 10,000-person organization. It is a coordination tax, exported from the producer to everyone downstream of the producer.
The Decision Density Tax (quality cost)
The cost of making consequential decisions in depleted capacity states. Vendor signed off on Thursday, reversed by Monday morning. Strategic call made at 5pm that turns out to have been the wrong call by Tuesday. The audit looks at when high-stakes decisions were made, the demand conditions around those decisions, and whether the surrounding capacity signals suggest elevated risk.
The pattern I keep seeing: organizations have plenty of process around which decisions get made and by whom. They have almost nothing around when. Calendar geometry decides. The cost shows up in rework, reversals, and the meetings nobody admits were called to undo last week's meeting.
The Recovery Debt Tax (attrition cost)
This is the tax that correlates most directly with people leaving. Recovery debt compounds in private. By the time it is visible to HR, it is usually too late to keep the person. The senior PM who quietly ran on fumes for two quarters resigns the week after she finally takes a real vacation. The vacation did not cause it. It surfaced what was already there.
UC Berkeley researchers documented the version specific to this moment: AI did not return capacity to workers, it absorbed the gain into expanded expectations. The pattern shows up across functions in their February 2026 analysis. The people absorbing the most validation load are the first to start updating their resumes.
The Capability Penalty
Recovery Debt does not land evenly. It lands hardest on your most capable people. The best people get more hard work because they are trusted. More complex problems. More emotional labor. More strategic decisions. More rescue work. So the most capable people often become the most depleted, and the depletion compounds in private long before it shows up in any HR signal.
These are also the people whose loss is hardest to recover from. The senior IC who quietly carried three teams. The director everyone routed escalations through. When the capability penalty lands hard enough, you do not lose a headcount. You lose the load-bearing wall. The audit measures Recovery Debt at the population level and flags the concentration on your highest-trust operators.
The Manager Load Tax (delay cost)
Your managers carry their own work plus their team's emotional and cognitive overhead, and right now they also carry a third load most org charts do not name yet: the validation load on AI output flowing through their teams. Discriminating acceptable AI work from accepted AI work routes through managers and senior individual contributors at higher rates than through any other layer. AI multiplies the volume of work passing through that bottleneck without adding manager capacity.
We measure manager capacity separately because manager depletion is the leading indicator. It shows up before team-level signals appear in any survey instrument I have ever seen.
The Forfeited Upside Tax (innovation cost)
The cost of what does not happen. This is the tax I have spent the most time on, and the one I am most willing to argue with skeptics about. Every other tax measures damage that occurred. This one measures opportunity that did not. The strategic pattern your team would have caught at Green capacity but missed in Yellow. The product insight that surfaced in a hallway and got lost. The competitor move you saw a quarter too late.
For organizations whose competitive advantage runs on creative output or pattern recognition, this is usually the largest tax in the system. It is also the only one no other diagnostic on the market is built to find.
Quantified through three inputs you provide: leadership interviews surfacing unacted opportunities, innovation pipeline attrition data, and your own opportunity valuation framework. The dollar figure is co-authored. We do not estimate it on your behalf.
The AI dimension worth flagging here is the long one, not the immediate one. An MIT Media Lab EEG study coined a useful term: cognitive debt. The discrimination muscle that surfaces strategic patterns atrophies when too much generative work gets offloaded. Year one looks like productivity. Year three looks like a workforce that cannot quite think the way it used to. The audit does not pretend to measure neural connectivity. It looks at how much of the work in your strategic populations is being generated by AI versus shaped by humans, and flags the populations where the ratio puts long-term pattern recognition at risk.
The 2024 to 2026 AI deployment wave did not create a sixth tax. It made the existing five run hotter. If you want the full research stack behind this, it is in the book and in the engagement scoping conversation. The page does not need to recite it.
Each tax measured against your data. Two of them, Recovery Debt and Forfeited Upside, anchor the top-line capacity cost. The other three are diagnostic lenses that show which patterns concentrate the cost and which interventions map to it. A business case, not a diagnosis.
For the longer treatment of how the 2024 to 2026 AI deployment wave is changing the capacity equation specifically, see AI Didn't Reduce the Work. It Changed the Demand Profile. The page covers the four AI mechanisms named in the chapter (validation load, workslop, cognitive debt, and sycophancy) and how each amplifies the existing five taxes.
How the Audit Works
The standard Department-tier engagement runs five weeks. Three data streams running in parallel. Minimal time required from your workforce. Smaller and larger tiers compress or expand the same shape.
Delivery: Team and Department Audits are typically delivered remotely. Interviews, surveys, calendar-pattern review, analysis, and the executive readout can all be completed without onsite work. Onsite workshops are available for larger engagements or leadership teams that want the findings translated into an operating redesign session.
Phase 1: Scoping and Discovery
We meet with executive sponsors, HR leadership, and operations leads to define the audit scope. We select the population (the team, function, or representative sample whose output depends on cognitive performance under pressure), get access to the data we need, and lock down the confidentiality architecture. Employee time required this phase: none.
Phase 2: Data Collection
Three streams run in parallel. A Capacity State Survey, 10 to 15 minutes per employee, voluntary, anonymized at the individual level. Meeting and calendar pattern analysis on aggregate, no individual surveillance. And 8 to 15 structured manager and leader interviews at 45 minutes each.
The manager interviews are where most of the actual signal comes from. The survey tells us the shape. The interviews tell us why.
Phase 3: Analysis and Quantification
We synthesize the three streams against your compensation, headcount, and productivity baselines. Each tax gets a number. We quantify the Forfeited Upside Tax with your leadership team, using your own opportunity valuations. Interventions get ranked by estimated top-line reduction per dollar invested. We pressure-test the findings with your executive sponsors before the report gets finalized.
Phase 4: Findings Delivery
You receive a 30 to 45 page written findings report, a 15 to 20 slide executive presentation, and a one-page COO Brief. We deliver the findings in a two-hour executive session: the patterns, the costs, the priorities, and the intervention sequence. You own all the data and all the deliverables.
Total employee time required: under 20 minutes per participant. Total leadership time: roughly 6 hours, spread across the engagement.
What You Receive
Lead Deliverable
COO Brief
A single-page brief with the organizational capacity cost top-line, the three operational patterns concentrating that cost, the structural changes recommended, and the expected ROI range. Built for the executive who has to decide what changes Monday morning. Most diagnostic firms produce sixty-page decks the operations team never opens. This is the page they will.
Findings Report
A 30 to 45 page report covering your capacity across the Five Taxes, the dollar cost of each, the patterns driving them, and a ranked intervention plan. No consultant vocabulary. No framework jargon we have not defined.
Executive Presentation
A 15 to 20 slide deck delivered in a two-hour working session. Built for the executive team that needs to make investment decisions on the back of the findings. You keep the deck for internal use.
Data Appendix
Raw, anonymized data from the Capacity State Survey and pattern analysis. Your internal team can run additional analysis, track improvement over time, or integrate with existing engagement and performance data.
Prioritized Opportunity Map
The interventions ranked by estimated top-line reduction per dollar invested. Some will be organizational (demand design). Some will be individual (the Emergent Skills app). Some will be managerial (certification). The map tells you where to start.
Implementation Pathway
A recommended next-step sequence. Whether that is a 12-week pilot, manager certification, demand design consulting, or an organizational license, the audit tells you which one matches your findings. No obligation to continue with us.
What a Finding Looks Like
We are in the design partner phase. We do not have client case studies to publish yet, and this page is not going to fabricate one. What we can show you is the structure every finding will follow.
Each finding has four parts: a specific pattern named, the dollar cost quantified, the recommended intervention, and the expected return. For a Forfeited Upside finding, that means an opportunity your leadership team identified and did not act on, correlated against the capacity state of the team during the decision window, valued using your own opportunity framework, and matched to a structural intervention.
If the strategy team was sitting at 60% Yellow and Red distribution against a baseline closer to 30%, the finding flags it as capacity-correlated. The intervention is structural. Protected Green-zone time for strategic review. Pipeline stage-gating tied to team capacity state. The cost figure comes from your numbers. The pattern comes from ours.
The full sample finding will appear here once the first design partner engagement closes and we have permission to publish.
Who Delivers the Audit
A senior practitioner leads the engagement. The senior lead has the consulting background to scope, run, and close an audit at enterprise scale, and is named in the engagement scoping call. Jim Wilde built the Five Capacity Taxes methodology. He reviews the work, makes the judgment calls on findings that do not fit a clean pattern, and joins the executive readout when it serves the engagement.
For Design Partner engagements specifically, founder involvement is heavier: methodology shaping at kickoff, findings review before delivery, and the executive readout. Once the firm scales past the design partner phase, that level of involvement is no longer part of the standard engagement.
Background on the methodology. Jim Wilde developed the Five Capacity Taxes across decades of enterprise systems work, including a nine-year tenure as lead dev/pm on mta.info, the public-facing digital infrastructure for the Metropolitan Transportation Authority. The framework is documented in CAPACITY: The Variable No One Measures.
Investment
Audit pricing scales with team size and scope. Ranges are directional. Most first engagements scope to a single team or department.
Team Audit
$15K to $25K
Single team, 5 to 15 people. The full methodology scaled to a team-sized engagement. 3 to 4 week timeline.
Department Audit
$35K to $55K
Department or sub-function, 15 to 75 people. Cross-team pattern analysis included. 5 week timeline.
Function Audit
$65K to $95K
Multi-team function or business unit, 75 to 300 people. Strategic-level findings. 6 to 8 week timeline.
Enterprise Audit
Custom
Multiple functions or a full division, 300+ people. Executive-level scope. Custom timeline and deliverables.
Audit sizing is based on the knowledge-worker population whose output depends on cognitive performance under pressure, not total headcount.
2026 Design Partner Cohort · Three Slots
Early adopters shape the category.
You have read the methodology, the structure, the pricing. The first three audits we run are different in ways that matter to the buyer who is comfortable being early.
What the three Design Partner slots trade is access, not price:
- Senior consultant leads the engagement, founder personally involved at the key moments. Specifically: methodology shaping at kickoff, findings review before delivery, and the executive readout. Once the firm scales past the design partner phase, founder involvement at this level is no longer part of the standard engagement.
- Methodology shaped to your organization while it is still being shaped at all. The Five Capacity Taxes have been pressure-tested at the individual and team level. Enterprise scale is where the framework gets sharpened. Design Partners shape what that sharpening looks like.
- Anchor case study positioning. When the firm scales, the first three names are the ones cited. Permanently.
- Quarterly executive briefings on cohort findings. Patterns surfacing across the three engagements, shared back. Outside-the-walls perspective from inside two other organizations doing the same work.
Design Partners receive 15% off the first engagement in addition to the access elements above. The slots are for leadership teams comfortable being early in a category, not the second wave that buys what the first wave validated.
Apply for a Design Partner Slot →
Applications close when the three slots are filled.
Start here if the audit does not fit at this time
The Work Demand Diagnostic is the fastest path to naming which of these patterns is driving cost in your organization. Half-day working session for managers and team leaders. Three hours. $3,500 to $7,500. No pre-work, no follow-on commitment.
Questions
Will my employees feel surveilled?
No. Individual data is never shared with the organization. The Capacity State Survey is voluntary and anonymized at the individual level. Calendar pattern analysis operates on aggregate patterns, not individual behavior. Manager interviews are confidential. The audit produces organizational intelligence, not employee surveillance.
Where does this not work?
A few places. If your organization is in active crisis, restructuring, layoffs in flight, leadership transition, the audit is not the right move yet. The data will not be stable enough to act on, and the recommendations will get shelved by next quarter's reorganization. Wait until the dust settles.
The audit also does not translate well to organizations where most output is not cognitively bottlenecked. Manufacturing floors, retail operations, logistics. Capacity matters everywhere, but the Five Taxes framework was built for knowledge work. We can audit the knowledge-worker layer of those organizations, but not the operational core.
And the methodology is new. Some of what we surface is going to be uncomfortable for organizations that prefer to manage by sentiment data they already trust. If your leadership team is not ready to look at a number that contradicts what the engagement survey is telling them, the audit will not change that.
How do you separate a capacity problem from a performance problem?
Not every performance problem is a capacity problem. If a person underperforms while rested, unloaded, clear on expectations, and not under threat, the cause is not capacity. It is skill, effort, role fit, or training, and it should be managed as such. Capacity Intelligence does not erase accountability. It sharpens it by forcing the first diagnostic question: does this person lack the underlying skill, or did they have it and fail to reach it under the conditions of the moment? The audit is built to tell those two apart, which is what keeps you from spending intervention budget on a capacity problem or excusing a performance problem as one.
What did methodology development surface that you did not expect?
Three things, all of which shaped how the audit is structured.
The first is from a previous venture. Before Emergent Skills there was a sleep app called MySleepPlan, built around CBT-I protocols. It asked depleted users to do exactly the kind of compliance-heavy work that depleted users cannot do. It did not work. The lesson built directly into the framework: design for the most depleted user first, not the most motivated. Treat capacity itself as the variable. That decision is why the audit measures access to skills rather than presence of skills.
The second is the AI integration. When we started reading the 2024 to 2026 wave of AI deployment research, I expected to find a sixth tax. The research showed something more useful. The existing five run hotter under AI tool concentration. That changed how the audit is structured. It now measures both the underlying tax and the AI-driven amplification of it.
The third is the Forfeited Upside Tax. In early small-team work, the act of structured interviewing surfaced opportunities leaders had stopped tracking consciously. Most leaders do not keep a running ledger of opportunities they passed on. The interview process makes them assemble one. That tax is now quantified through three inputs the client provides rather than estimated by us. The numbers come from their inputs. The correlation comes from ours.
How is this different from an engagement survey?
Engagement surveys measure sentiment. The audit measures capacity. Whether your people had access to their full skill set when the work actually got done. Engagement tells you how employees feel. The audit tells you what state they were in when they made the decisions that mattered. Those are not the same question, and they do not lead to the same intervention. Organizations can score well on engagement and still be quietly losing capacity.
If there are five taxes, is the bottom-line number just the sum?
No. Summing the five would double-count the same underlying damage observed through different patterns. A wasted meeting hour also contributes to burnout and to manager absorption load. One phenomenon, multiple observations.
The audit's top-line organizational capacity cost combines two figures that do not overlap: the Recovery Debt Tax (the research-grounded downside anchor) plus the Forfeited Upside Tax (a distinct upside construct). The other three downside taxes are diagnostic lenses that tell the intervention story: which pattern concentrates the cost and which intervention maps to it. The findings report explains this. The COO Brief leads with it.
How do you quantify the Forfeited Upside Tax without fabricating numbers?
We do not fabricate numbers. We quantify it through three inputs you provide: leadership interviews that surface specific opportunities your team identified but never acted on, innovation pipeline attrition data, and your leadership team's own opportunity valuation framework. The dollar figure is co-authored. You provide the opportunity value. We provide the correlation with team capacity state. The finding is defensible because the numbers come from your own inputs, not our estimates.
Does the CUNY/JHU benchmark apply to our industry?
The CUNY/JHU model is an industry anchor, not your number. Your industry, geography, and workforce composition shift the underlying assumptions. The audit produces a figure specific to your organization, using your compensation data, your workforce composition, your survey results, and your operational baselines. The benchmarks are why the category exists. The audit is why you would act on it.
Can we audit a specific team or function instead of the full organization?
Yes. That is how most first engagements are scoped. The audit applies to the population whose output depends on cognitive performance under pressure: knowledge workers, managers, decision-makers, creatives, engineers, analysts, clinicians, deal teams. Most organizations start with a single team or function and expand from there if the findings justify it.
What is required from our IT team?
Minimal. Survey distribution goes through existing HR channels. Calendar pattern analysis runs via voluntary opt-in tool or aggregate export. No data integration, no infrastructure changes, no persistent monitoring.
What if the findings show the problem is leadership behavior?
In most organizations, some portion of capacity drain traces to leadership patterns. The audit names those patterns without naming individuals. Findings are structural, not personal. How your organization chooses to address them is your decision. We provide the data and the framework. Not the internal politics.
Do we have to commit to implementation after the audit?
No. The audit is a discrete engagement. You own the data and the recommendations. Most organizations choose to continue with an implementation engagement because the ROI math is favorable, but there is no obligation. The work stands on its own.
Does the audit require onsite work?
No. Team and Department Audits are typically delivered remotely. Interviews, surveys, calendar-pattern review, analysis, and the executive readout can all be completed without onsite work. Onsite workshops are available for larger engagements when the leadership team wants a working session around the findings.
Start With a Conversation
Every audit starts with a scoping call. Tell us what you are seeing, what you have tried, and what you are trying to understand. We will tell you whether an audit fits, what it would cost in your case, and what a realistic set of findings looks like for your organization. Typical scoping-to-kickoff is 2 to 3 weeks.